Many businesses want to examine revenue for various product lines or item types such as units versus accessories separately. However, by default Dynamics CRM (Customer Relationship Management) uses Closed Opportunities when reporting revenue. The opportunity closing dialog allows the user to accept the system-calculated revenue from the opportunity or enter a different number. While this gives an organization some flexibility in choosing how to record the revenue from won opportunities, it does not allow for more fine-grained reporting by product type sold. In order to get reporting at this level of detail, you need to derive it off order products rather than opportunity. This article demonstrates how to create views and charts to get this information out of the system.
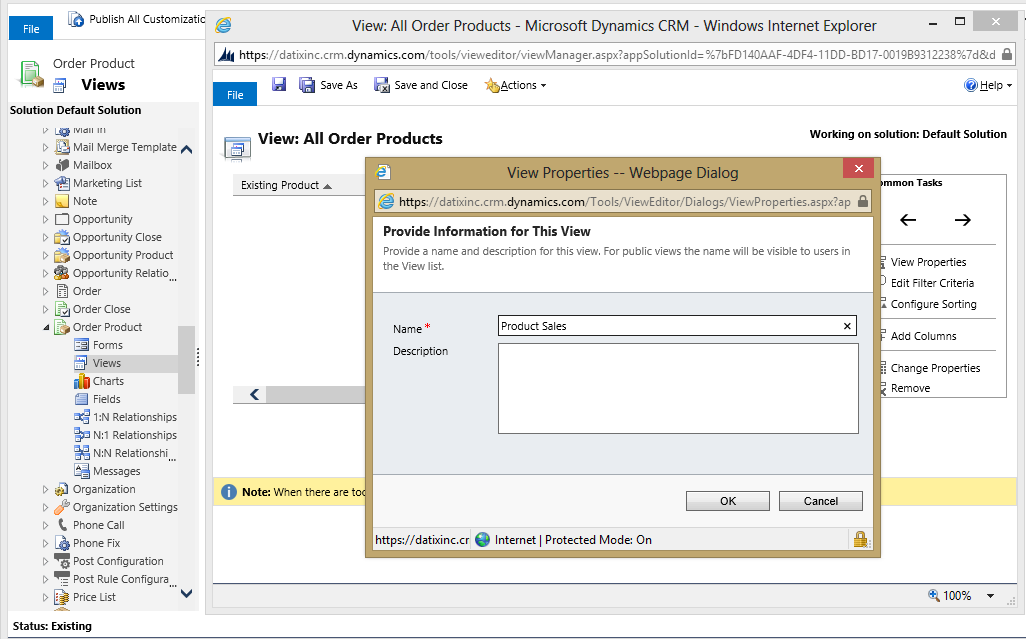
Open Customizations and navigate to the Order Product entity. Select Views and choose the Default Public View of All Order Products. Select Save As and give your new view a descriptive name.
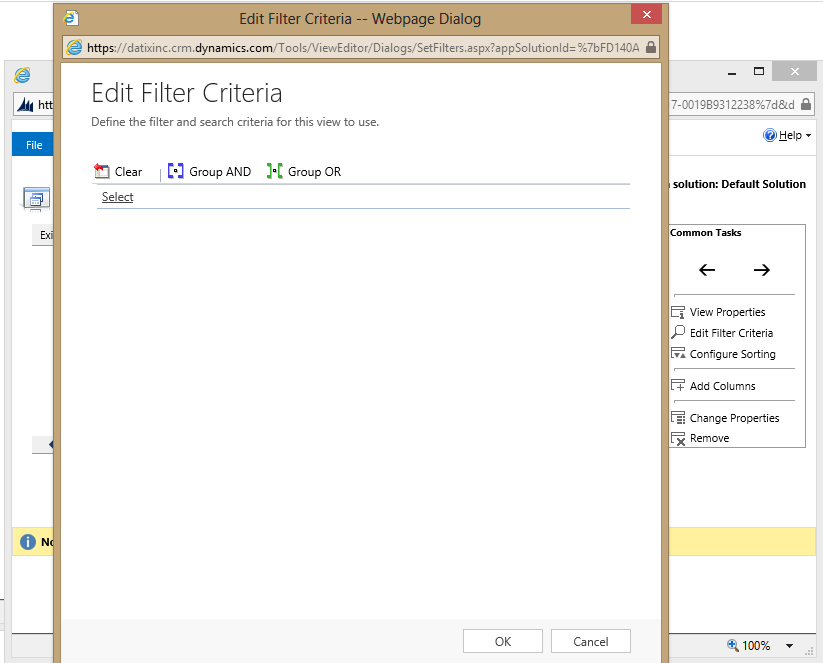
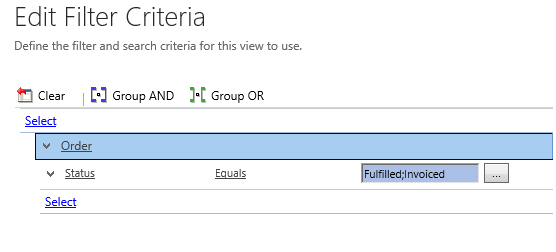
Select Edit Filter Criteria to open the query window.
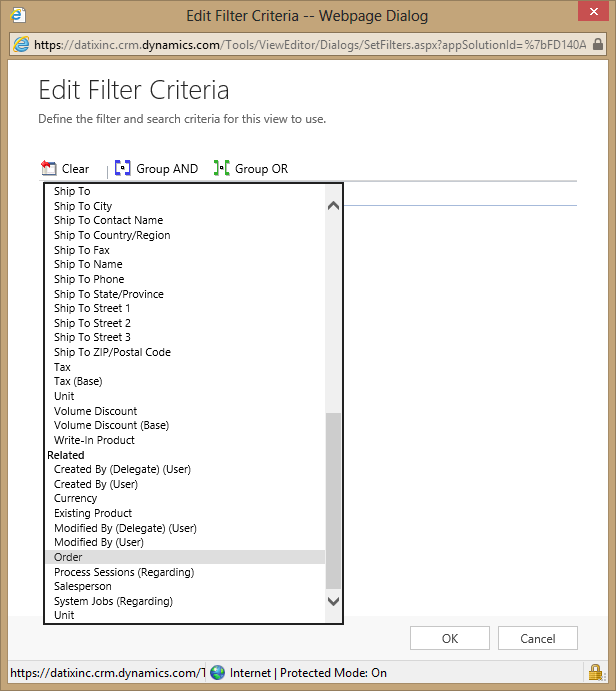
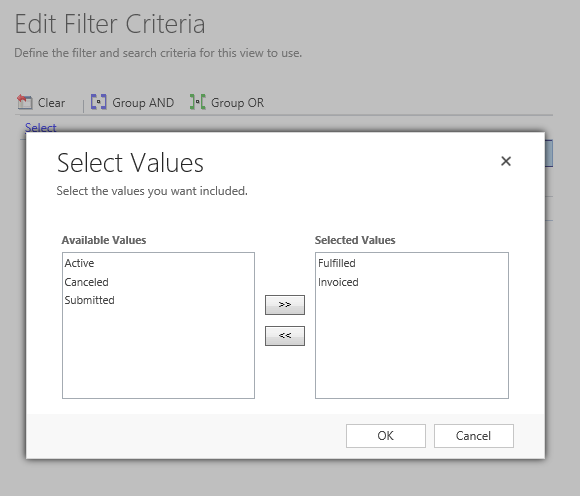
Open the drop-down and scroll past Fields to the section called Related. Choose Order. In the next drop-down that appears below, choose the field Status and then set it Equal to Fulfilled;Invoiced. This will ensure your view is pulling revenue only from fulfilled or invoiced orders.
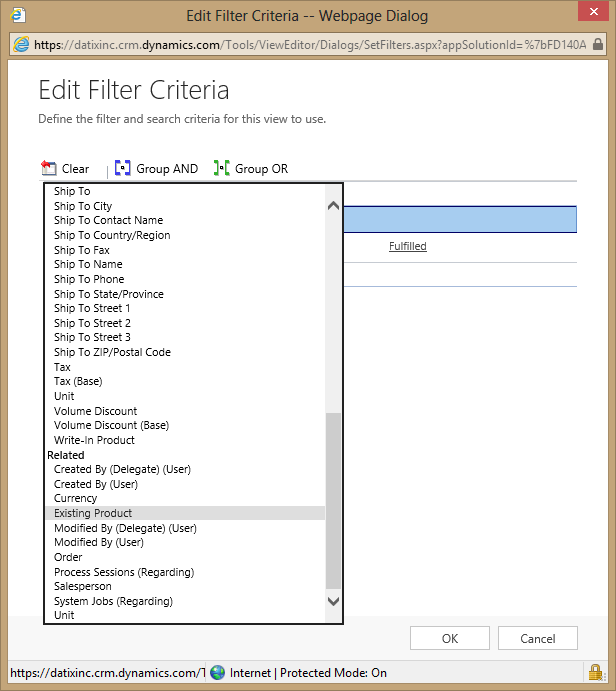
Next, go back to the top of the window and hit Select to reveal another drop-down menu. Choose the related entity of Existing Product from this menu. It’s important that you use the drop-down menu at the top of the window, as this will allow you to select entities related to Opportunity Product. If you choose the drop-down below the Order query, it will give you options to choose entities related to Order instead. By using Existing Product in your query, you will be able to access fields on the Product entity related to the items in your Product Catalog.
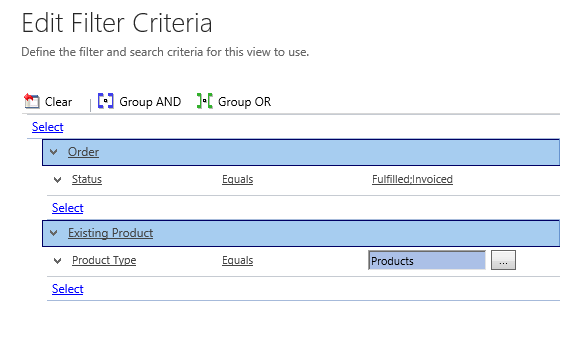
Below Existing Product, choose the field Product Type from the drop-down menu and then set it Equal to whichever product type you want in your revenue report. The Product Types can be customized by editing the option set in the Product Type field on the Product form, or you can define additional fields to use in slicing your data. Once you have your query defined, hit Okay to save the query and return to the Edit Columns screen.
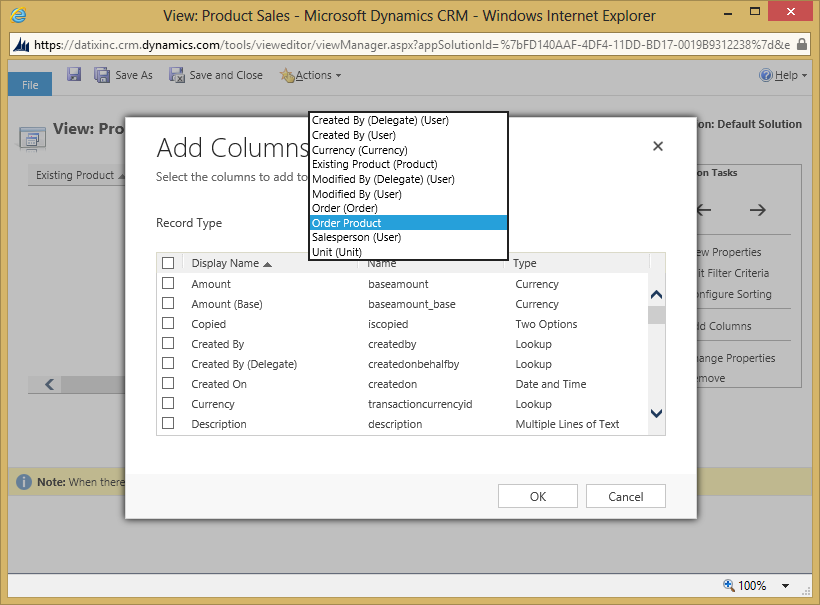
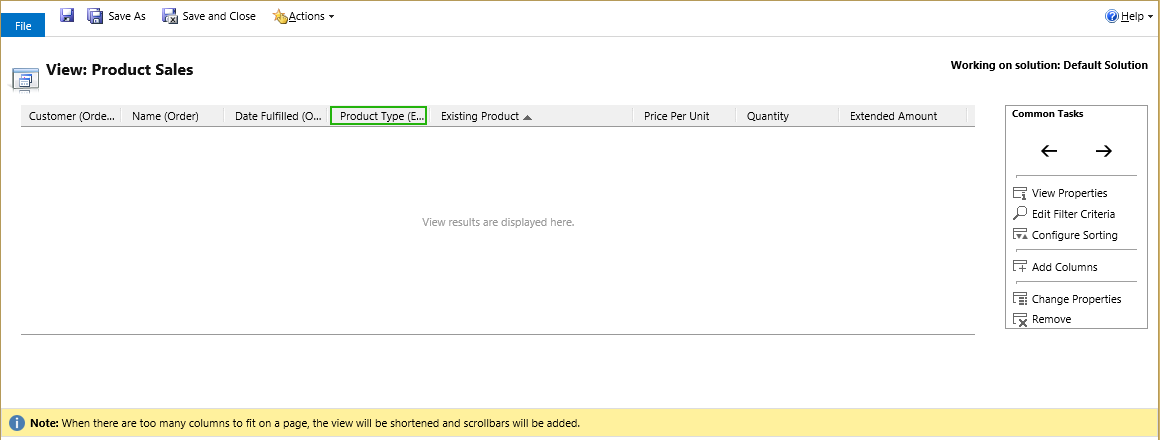
On the Edit Columns screen, select the columns that you want to see in your list view by choosing Add Columns from the menu on the right. You can add fields from Order Product, Order, or Existing Product. Suggested columns to add from Order are: Customer, Name, and Date Fulfilled. From the Order Product: Existing Product, Price Per Unit, Quantity, and Extended Amount. From Existing Product, Product Type.
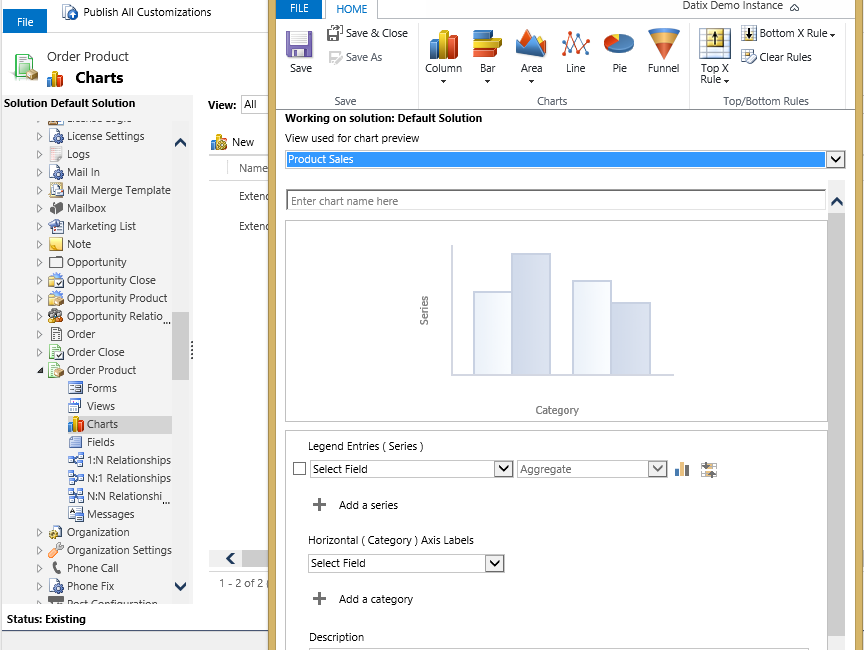
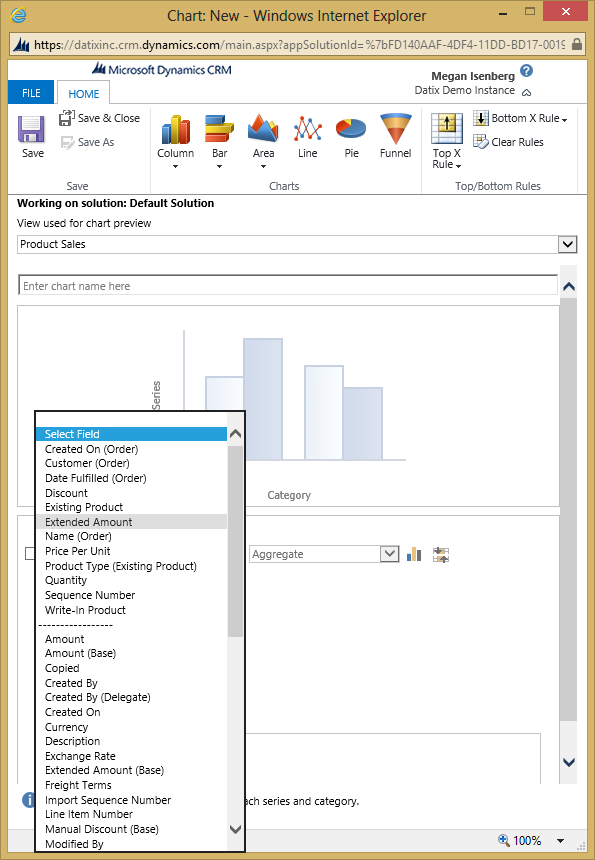
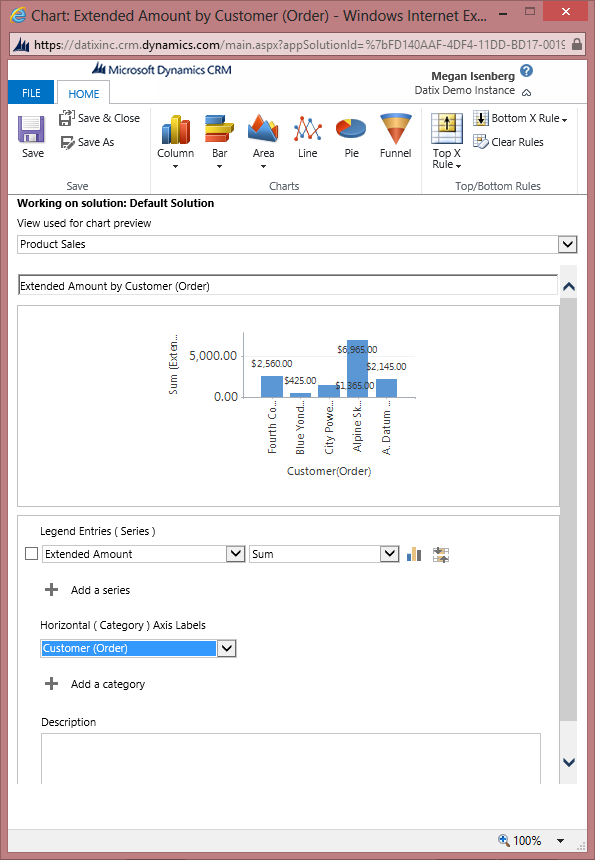
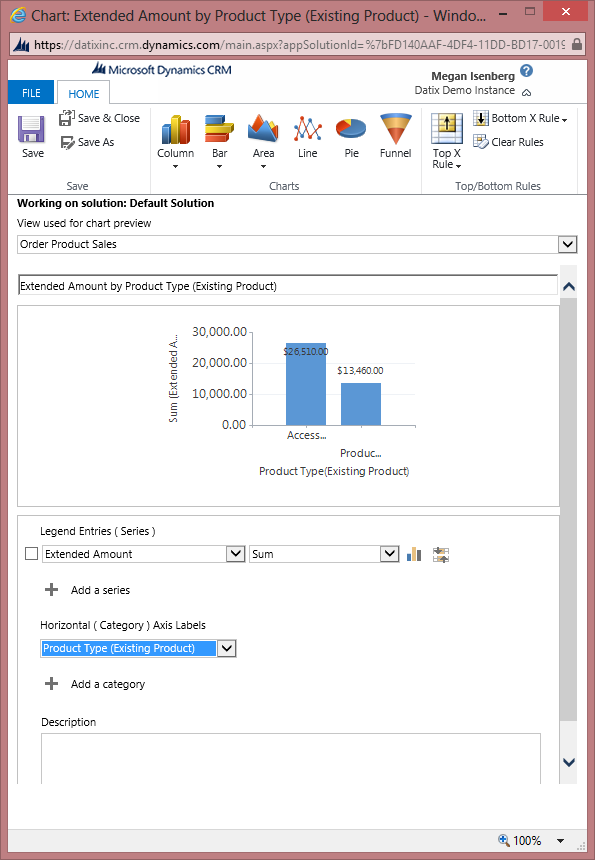
Depending on how you want to view your data, you may want a list or a chart. In order to create a chart from your new view, navigate to Charts under Order Product and select New. Choose the view you just created under View used for chart preview. For the Legend Entries (Series), select an option such as Extended Amount or Quantity. For the Horizontal (Category) Axis, select the category by which you want to split the results, such as Customer (Order) or Date Fulfilled (Order). A suggested chart title will populate and a preview will display. Click Save & Close.
To create additional views for different product groups, open the view you’ve created, choose Save As, and then modify the query by substituting a different selection following Product Type Equals. To create additional charts, you can either Save As or create New, depending on how similar the requirements are.
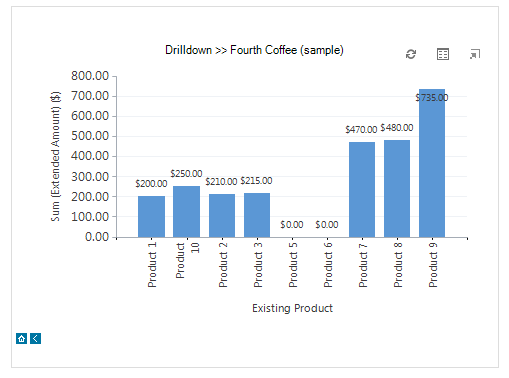
You can create a chart that compares revenue by product type side-by-side by omitting the Product Type parameter from your query and using Product Type as the Horizontal (Category) Axis of your chart.
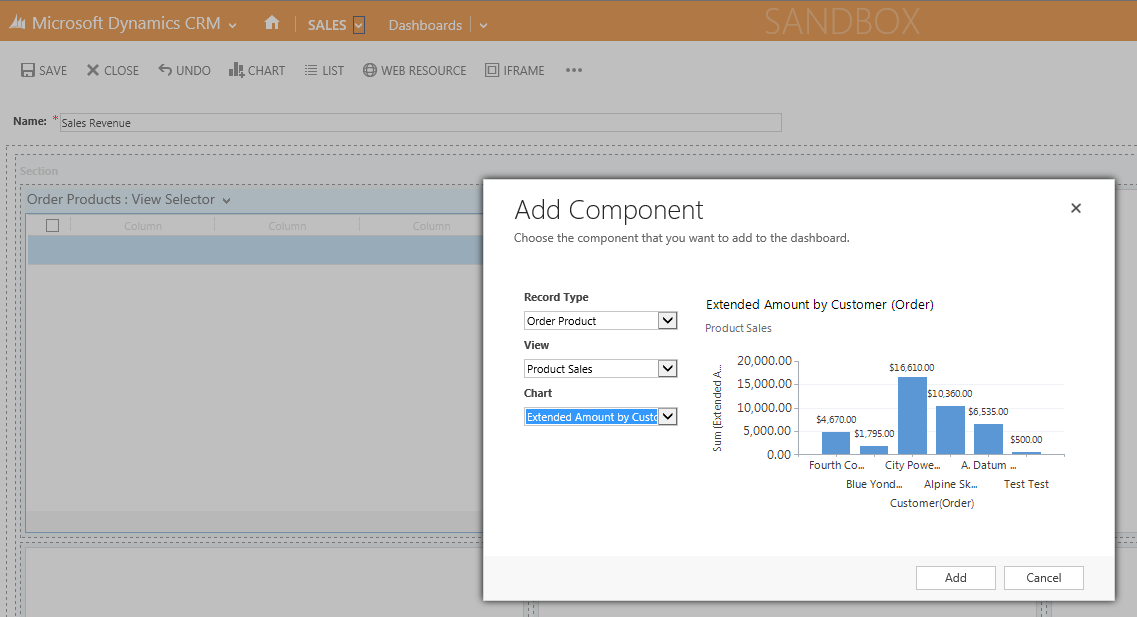
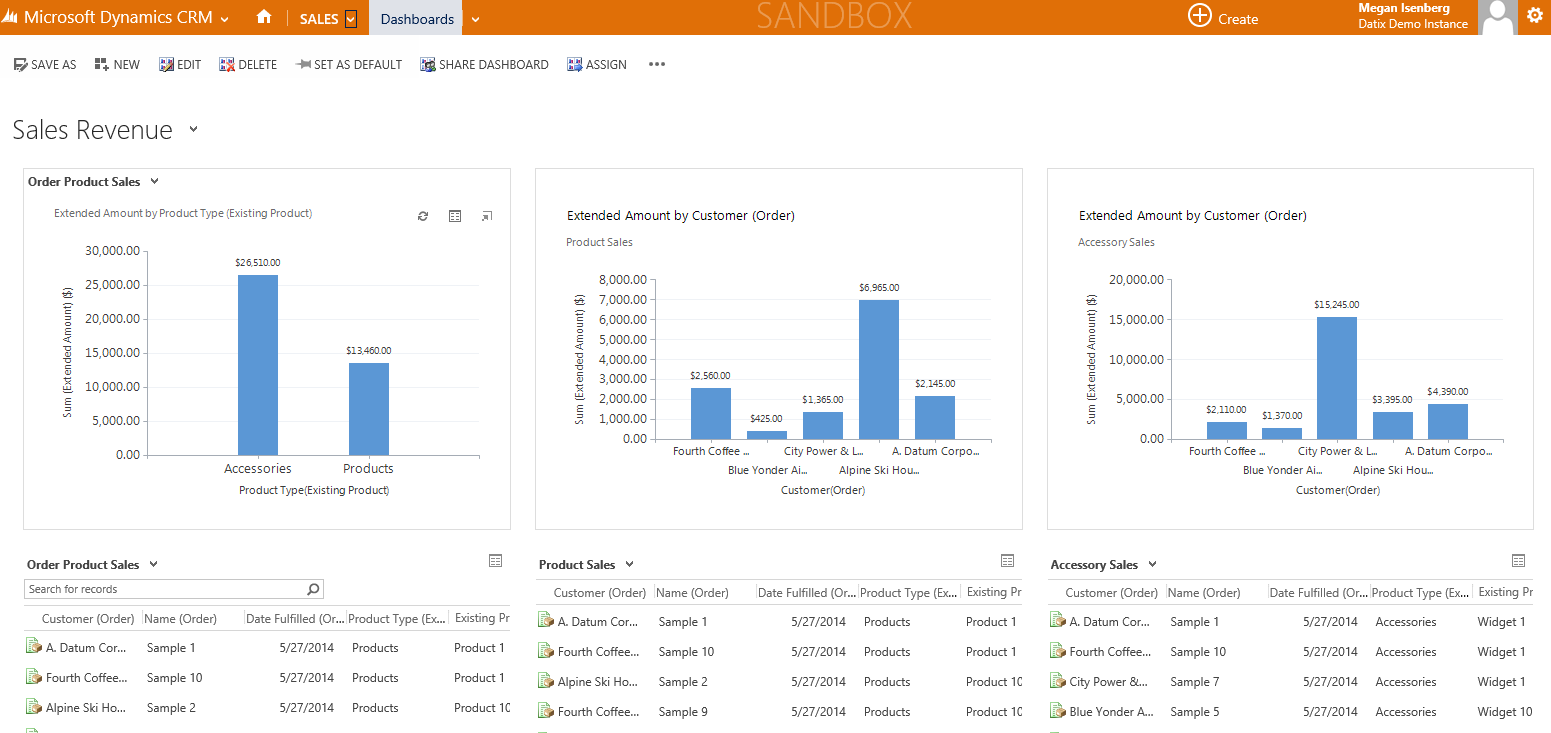
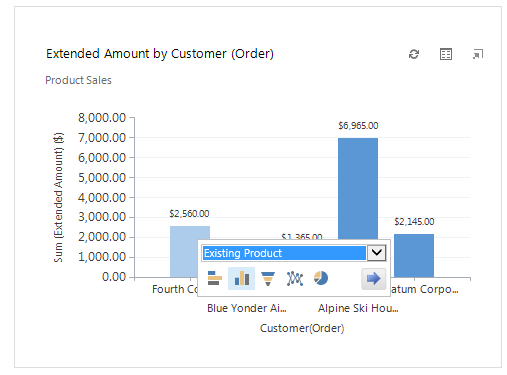
Dashboards are a great way to get a quick, up-to-date overview of the sales revenue status. To add a new dashboard, go to Sales, Dashboards, and select New. Choose a layout and select Create. Give the dashboard a name and click Save. Click List or Chart to add a component. For a list, choose Record Type: Order Products and one of the views you created. For a chart, select Order Products, a View, and a Chart. Save and close the dashboard to view the results. You can drill into charts or select an item from the list to go to that record.
I hope you have found this helpful in getting detailed, high-quality data out of your CRM system. If you have any questions about this or other Dynamics CRM functionality, leave a comment or contact us.
Suggested
Stuck on your project? We can help:
Entering Records individually into CSI will ensure that the required data is filled out for…
For decades, Infor VISUAL ERP has been the backbone of countless manufacturers. Its strength lies…
Infor CSI (Syteline) - Features & Options With the creation of Infor Configure Price Quote…
Infor CloudSuite Industrial (CSI) provides powerful reporting capabilities, often leveraging Dataviews for easy extraction of…
In today’s fast-paced manufacturing environment, efficiency, accuracy, and scalability are critical for business success. Infor…
Platform: HubSpot Where It Shines: Email marketing - easy to use email lists, automation, and…